(Due by noon on the due date. Was originally May 3, but there’s not enough time for the last project, so if need it, have a couple extra days.)
Objective
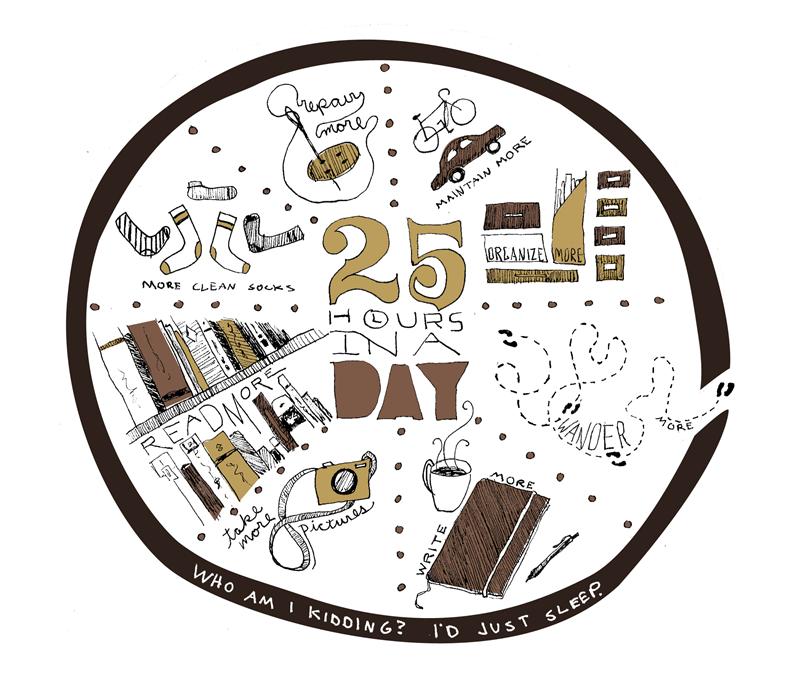
An infographic is meant to present information — statistical, chronological, or other data — in such a way as to engage the viewer and to provide a more interesting method of relaying information than a list of facts and figures. The design needn’t necessarily be a series of exact graphs and diagrams; it does, however, need to compel the viewer to continue reading. Infographics typically relay a large amount of information, so you must keep the attention of the viewer long enough to impart your message.
The focus of your piece should be the information you’re presenting. The graphic elements that you will create (other than backgrounds, bars, etc) are there to display and draw attention to that information, not to simply adorn it. If you can do both at once, that’s a plus.
Objective
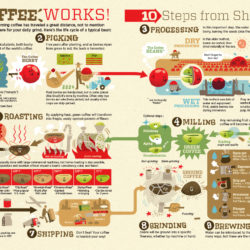
You are to create a graphic version of the life cycle of some product, from its very beginning (say, picking a coffee berry) to a cup of Roasters coffee being enjoyed by a dude with a handlebar mustache. Naturally, this infographic will be chronological in nature, because you are showing the steps along the way to make something into a new, more complicated and consumable thing.
Some examples of approaches include:
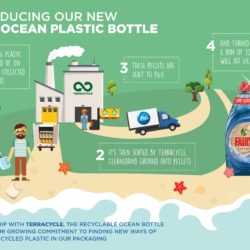
- The example above: the process of harvesting coffee berries to drinking a cup
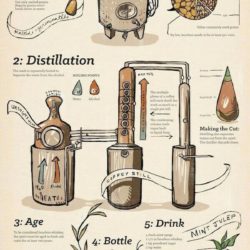
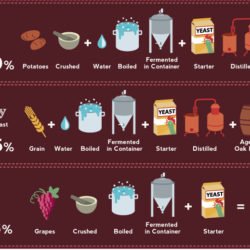
- The journey of some corn, rye, wheat to becoming a bottle of bourbon or grapes to fine wine
- The mining of metal ore to ultimately a person riding a bike which is the product of that process
- A little tadpole turning into an arrogant type-designing, pedal building adult-child
Project Specs
- At least 10″ x 15″ (May be vertical or horizontal), but the proportions and size can vary beyond that
- CMYK, Any Paper
- Digital Submission (unless physical becomes an option somehow?)
Project Focus
- Good balance of graphic and textual presentation of information
- Strong typographical hierarchy
- Content that is textually rich but not unappealing
- Use of type, image, and design principles to guide a viewer through a graphic work.
Project Requirements
- A title and a subtitle.
- At least 2 deliberately chosen fonts
- At least one display of 3 dimensional typography: this can be interpreted in many ways. The examples show a couple.
- 3 different levels of type hierarchy.
- A clear chronological flow.
- At least six bits of information of at least a sentence or two. This means there should be around six steps in the process which you identify.
(Do a word count of your main, textual content. If it’s lower than around 120, you probably don’t have enough content.) - At least 1 graphic representation of information (like a bar graph or pie chart), but 2 will often be better
- A roughly equal balance of imagery and type content. If your type is treated as graphic information, then the balance will swing a bit of course
No photography is allowed. Illustration should be original (you should be able to show some sketching/inspiration/research material). Items that would simply be busy work to draw (The contour of the US, for example) may be obtained via the web, but this must be approved.
Instructions
Step 1
Begin researching the concept and style of your piece. You should explore several approaches (at least 3, with sketching for each) so you’re sure to have a concept for which you can compile and create enough material. Discuss with instructor for guidance and approval of your general concept by the class after assignment. There isn’t an exact amount of information that is required; this will differ based upon your approach, which is why you must discuss what you’re planning and ensure there’s enough information present to fulfill the project. Your sketches/ideas are due the class after assignment. You may explore, in your sketches, different end products (ketchup, coffee and a bike).
Step 2
Begin gathering materials and content for your graphic. You should not be creating graphics yet until you have gathered at least the majority of your content and therefore know what your design is going to represent.
Step 3
Begin creating your working file in Illustrator, continuing to seek and take feedback from peers and instructor as you work on your project to completion.
Submission
Place your working file(s) and a full-size pdf proof with no bleed in a folder labeled [lastname_first-initial_project4] and place it in the drop box by the beginning of class on critique day. Have your full-size printed piece ready at the beginning of class as well.
- Folder with working files, PDF proof
Full-size physical submission
Resources
- good.is – Tons of infographics
- http://visual.ly – Even More Infographics
- Simple 3D Text
- Simple 3D Text with Perspective
- 3D Text with Blend Tool
- 2 Point Perspective Demo